

Monitoring anthropogenic carbon dioxide (CO2) and its emissions is a challenging but vital task to mitigate global warming. The Copernicus Atmosphere Monitoring Service (CAMS) and Carbon Monitor collaborate to provide near-real time daily CO2 emission estimates for six activity sectors in the European Union and United Kingdom through the CAMS website.
Carbon Monitor provides one of the most advanced and CO2 emissions datasets in the world regarding day-to-day variations, thanks to a comprehensive inventory approach to produce daily estimates. The dataset monitors variations in CO2 emissions from fossil fuel combustion and cement production from 2019 onwards. Estimates are based on a wide range of activity data, including electrical power generation, and industrial production indices for 62 countries or regions as well as mobility data for 416 cities, with near global coverage. The inventories are adjusted to allow for temperature variations, to calculate fuel consumption. The unique advantage of these data is that they are collected, processed and made available to CAMS with a one-month latency, allowing to assess rapid changes due to economic shocks and climate extremes.
In cooperation with CAMS, Carbon Monitor has produced Carbon Monitor Europe (CM-EU), an extension of the Carbon Monitor dataset covering the 27 members of the European Union and the United Kingdom, now accessible from the CAMS website.
“CAMS is progressing rapidly with the implementation of a novel greenhouse gas monitoring capacity and the Carbon Monitor project drew our attention very quickly for its near-real time, near-global coverage and the accessible interface. Therefore, the rapprochement between CAMS and Carbon Monitor occurred very naturally and we are very happy to provide our users with this excellent tool,” says Richard Engelen, CAMS Deputy Director in charge of the greenhouse gas monitoring capacity.

The near-real-time CM-EU data illustrates well the influence of human activity in CO2 emissions’ fluctuations, with clear differences between workdays, the seasons, or exceptional events such as the COVID-19 crisis or the Ukraine conflict.
“Our team, together with scientists from across the world, supported by CAMS, made an amazing job to develop this specific dataset updated each two months, everyone kept in mind that monitoring CO2 is a key challenge, in particular for Europe,” says Philippe Ciais, a scientist at France’s Laboratoire des Sciences du Climat et de l’Environnement, and one of the “fathers” of Carbon Monitor, together with a group of scientists from Tsinghua University, the Chinese Academy of Sciences and the University of California, to name a few.
“For the first time, Carbon Monitor provides quasi near-real time country-level data for Europe and the UK, compared with the lag of more than one year of the current official inventories. Our efforts and those initiated by CAMS will no doubt help Europe to better understand and monitor the impact of the measures taken to reduce CO2 emissions,” says Ciais. A paper detailing the work to make CM-EU happen was published in June 2023 in Nature scientific data.
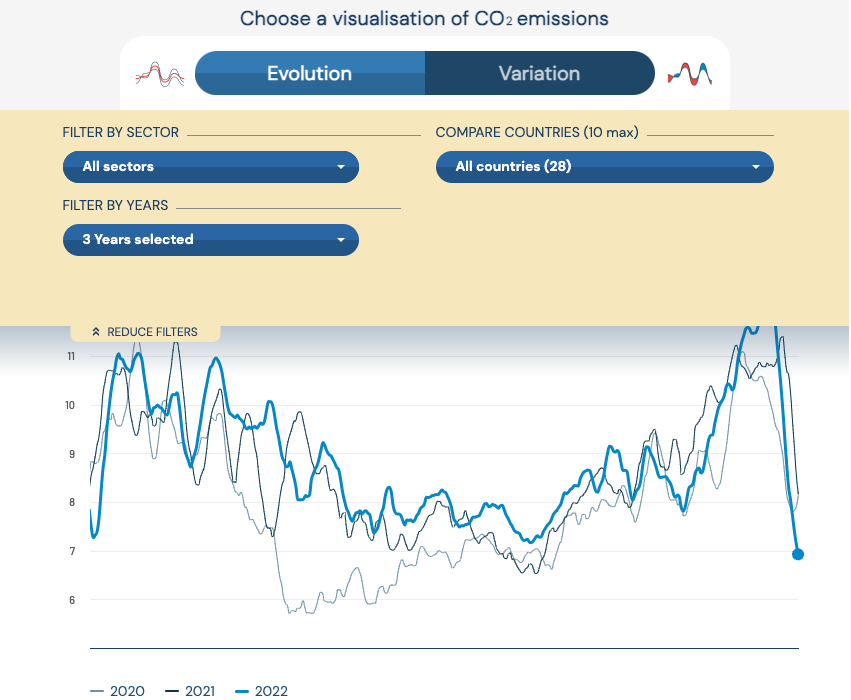
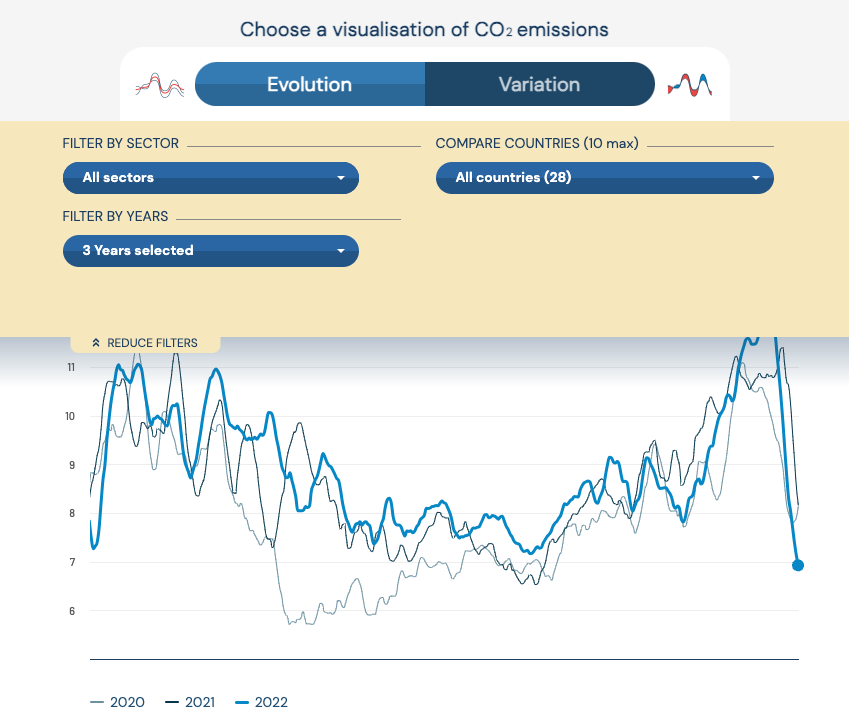
The CAMS web page provides intuitive interactive charts, allowing us to explore, compare and also download and share the data.
“Our teams worked very hard to provide this visualisation tool, we are very proud of it, and it was a joint effort to adapt it to CAMS requirements and the focus on Europe,” explains Ciais.
On the top menu, you can select Global/ European/ or Cities data.
Then, from the main menu,you can filter the data by Sector, Country or Year (for a maximum of three years).
The platform also provides information on the evolution and the variation of emissions, with a clear explanation of each point, which you can access by hovering over the chart.
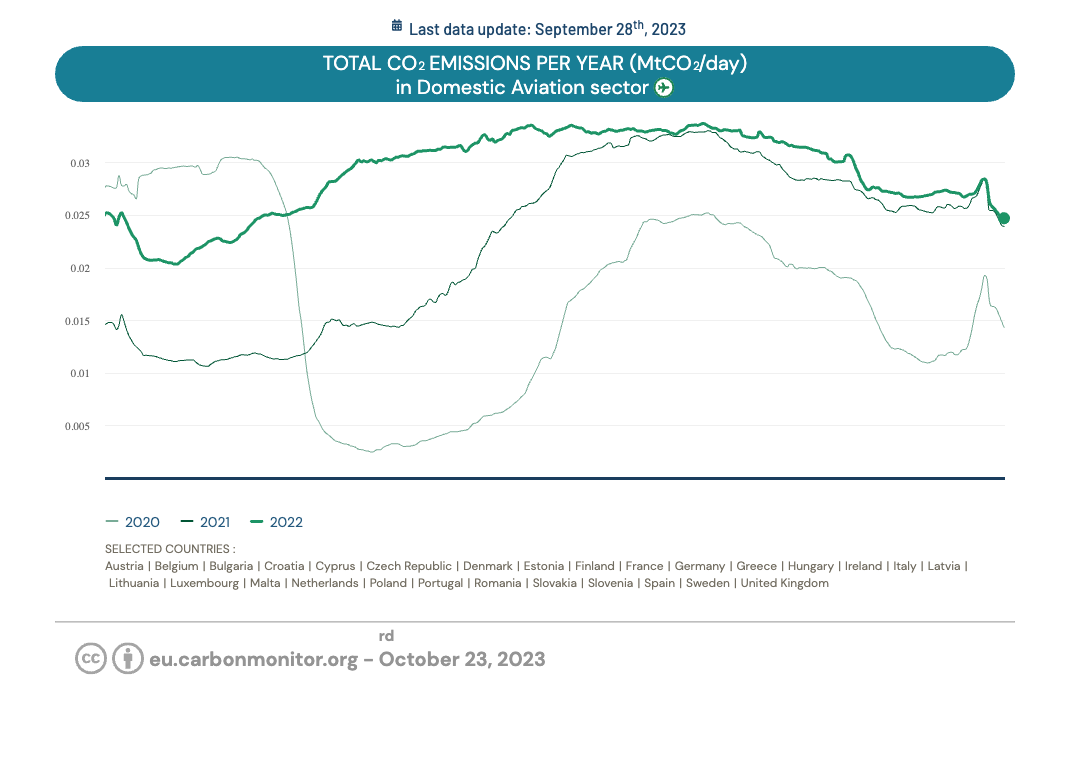
For example, we can see a historic drop in emissions from domestic aviation during the COVID-19 crisis in 2020, and the quick recovery during 2021, with higher values than before the lockdowns and the relative freeze in activity. The recovery during 2021 took some time.
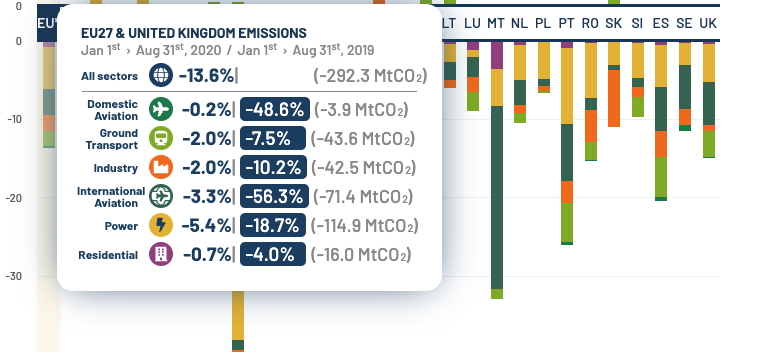
But we can also see the variation, by country, between any two years. For example, the drop in emissions between 2020 and 2019 is remarkable, especially when it comes to international aviation.
Once the data is selected, you can download the graphic or the data in XLS format, to reproduce the chart at your convenience. The selection resets automatically when you change tabs.
CAMS efforts towards an innovative anthropogenic greenhouse gas (GHG) emissions monitoring system are speeding up in recent months, in parallel with the involvement of the service in the World Meteorological Organization’s Global Greenhouse Gas Watch initiative.
On 19-21 September CAMS hosted a Global Greenhouse Gas Watch Modelling Workshop in Bonn, which resulted in a fruitful exchange between experts from the relevant disciplines to discuss standards and best practices in GHG monitoring and data exchange.
The discussions continued at the “Observations within the Global Greenhouse Gas Watch” workshop hosted by the World Meteorological Organization (WMO) in Geneva on 3-5 October. This meeting focused on the observational aspects of GHG monitoring.
CAMS was involved since the very beginning in the WMO discussions towards a GGGW and will play a role in the future capacity.
In parallel, scientists are working at full capacity to develop the Copernicus anthropogenic GHG monitoring system led by CAMS. Collaborations such as the one with Carbon Monitor are a good example of how models can tackle the challenge of monitoring GHG emissions in a timelier and more effective way. CAMS efforts in modelling and dedicated satellites to be launched as part of the European Earth observation programme Copernicus will provide a major shift in our understanding of the cycle of not only carbon dioxide, but also methane and nitrogen dioxide.
While measuring CO2 concentrations in our atmosphere is relatively simple, provided that it is done with the appropriate methodology, the current surface networks and existing satellites provide a relatively sparse sampling of the atmosphere that only allows to assess natural ecosystems fluxes, but not yet emissions. Separating CO2 emissions from natural CO2 fluxes and understanding the ratios and dynamics between sources and sinks is much more arduous. The Copernicus CO2M constellation of spaceborne imagers, in preparation by ESA and EUMETSAT for launch in 2026, is expected to be a game changer as the satellites will allow to estimate emissions, and CAMS is actively preparing to assimilate these data.
Thanks to advances in modelling and atmospheric science and with a hand (or an eye) from space, the future generation of more performant satellite sensors, Europe will soon take the lead in anthropogenic GHG monitoring with a state-of-the-art operational capacity in support of the ambitious European policies to cut emissions.