
We first provide a global view on risk perception and resilience on Figure 1, where the mean perception index \(P^k_c\) from each region is illustrated. We analyse all the risks surveyed in the dataset, namely crime, water, food, work accident, mental health, traffic crashes and serious weather events. For each risk, we give a value of 1 if the respondent is “very worried”, 0.5 if they are “somewhat worried” and 0 if they are “not worried” towards the risk. Figure 1 was created by using the Plotly Open Source Graphing Library in Python39, version v5.9.0.

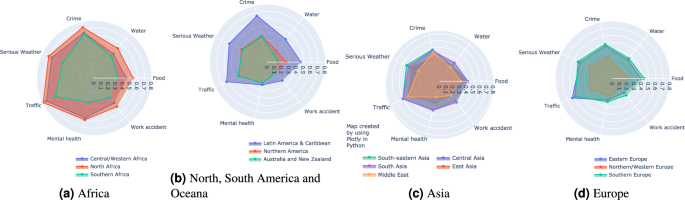
Perception index of different risks in different regions.
Larger charts represent higher perception indices, indicating greater levels of worry or concern towards each respective risk. Across all regions, “crime” and “traffic” (i.e. road crashes) consistently emerge as top concerns based on the Perception index values. This indicates these two risks are viewed with high levels of worry globally. “Serious weather” and “food” risks also rank among the top concerns globally, though slightly lower than crime and traffic risks. Still, the high perception index values reveal these are seen as major risks worldwide.
Overall, people from regions with more developing nations (Africa, Latin America, Caribbean and Asia) tend to have greater levels of concern about the risks. In contrast, regions with more developed countries (Northern America, Northern/Western Europe, Australia/New Zealand) exhibit lower perception index values for the risks, indicating relatively lower levels of concern. The stark contrast between perception index values in developed versus developing regions is especially noticeable for traffic, crime, serious weather, and food risks. The pattern suggests individual risk perceptions are shaped by the level of economic and social development of one’s geographical region.
Figure 2 shows a comparison between how people perceived risks (\(P^k_c\)) and their self-reported experience (\(E^k_c\)). Here the value of \(e_{i,c}^k\) is either 0 (no harm), 0.25 (know someone who experienced harm), 0.5 (experienced harm) or 1 (both).

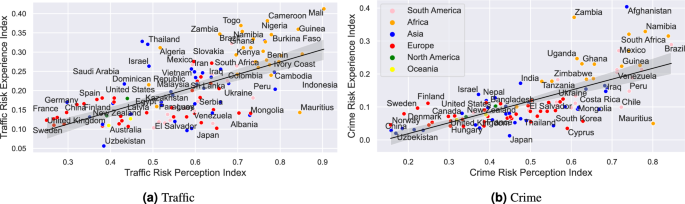
Risk perception index vs experience index of Traffic and Crime.
We only show Traffic and Crime risks on Figure 2, the remaining 5 risks can be found in Appendix B. Countries perform better if they are close to the bottom left corner of the graphs (both Perception and Experience indices are low) rather than being in the top right corner. Figure 2 shows that there is a clear positive correlation between the risk perception index and experience index, indicating that actual experience of harms is associated with greater perceived risk levels. This aligns with the existing empirical data in literature showing that direct exposure or experience with a risk can heighten subjective perceptions of that risk5,11. However, the strength of correlation varies – it is stronger for traffic risk than crime risk, suggesting additional factors also influence crime risk perceptions. Many European and Asian countries, especially developed nations, cluster toward the bottom left corner, reflecting both lower risk perception and experience indices, whereas African nations are predominantly concentrated in the top right corner. Countries which are located below the regression line are generally concerning more about risks than they actually experienced when in comparison to other countries. We find more European and Asian countries on this side, whereas the top of the regression line has more developing countries, especially those in Africa.
Finally, a new Resilience Index is proposed using 8 questions related to personal resilience in the World Risk Poll dataset:
-
Suppose you lost all of your household income, how long would you be able to cover your basic needs?
-
Do your neighbours care about you and your well-being?
-
Is your national government well prepared to deal with a disaster?
-
Are your hospitals well prepared to deal with a disaster?
-
Are you and your family well prepared to deal with a disaster?
-
Is your local government well prepared to deal with a disaster?
-
Could you protect yourself and your family in a future disasters?
-
Is the plan for future disaster known by all household member in your family?
Similar to the way of defining other indices, we encode the answers for these questions with a value between 0 to 1. We assign 1 to the most resilient answer (e.g. “Yes, well prepared”), 0 to the least (e.g. “No, not well prepared”) and 0.5 to the unsure answer (e.g. “It depends”). Since the answers are subjective, the new Resilience index measures perceived resilience, or how much an individual thinks they can recover and adapt to a disaster. Here “disaster” refers to major adversity events in general. They can arise from both natural and anthropogenic causes, e.g. financial security or failure of vital infrastructure.

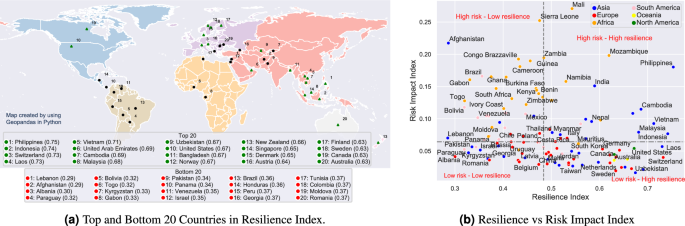
Figure 3(a) shows the top and bottom 20 countries in Resilience Index and reveals distinct patterns across the globe. Here the map was created by using Geopandas 0.13.2 in Python40. In the top 20, the presence of Southeast Asian countries such as the Philippines, Indonesia, Laos, Vietnam, and Cambodia is remarkable. These countries, despite being frequently exposed to natural disasters due to their geographical location, have residents who believes in themselves, their communities and local governments (high perceived resilience score). This is possibly driven by effective local community engagement, robust disaster preparedness strategies, and tailored infrastructure adaptations41.
The high Resilience index scores in economically prosperous countries like the United Arab Emirates, Switzerland, United States, and Singapore show that their citizens believe in the substantial investments in infrastructure, technology42, and public health,43,44 coupled with strong governance and institutional frameworks that enable effective risk management and disaster response. Among the Nordic countries – Norway, Denmark, Finland, and Sweden – renowned for their high-quality public services, community trust, and comprehensive social security systems, their high Resilience scores underscore the importance of social factors and public services in promoting societal resilience45.
On the other hand, the bottom 20 countries present a contrasting scenario. Lebanon and Afghanistan, both grappling with prolonged political instability, insecurity, and economic crises, exhibit the lowest Resilience scores. This suggests that political stability and security are key determinants of perceived resilience. The presence of Eastern European and Latin America countries such as Albania, Paraguay, Bolivia, and Moldova indicates that economic challenges, including poverty and income inequality, might negatively impact subjective resilience among residents46. This could be due to limited resources for investment in risk mitigation and disaster recovery, along with weaker public institutions and infrastructure47,48.
Moreover, it’s worth noting that some countries, such as Israel and Brazil, which have advanced technological capabilities or significant economic size, also fall into the bottom 20. This might hint at the complex nature of resilience, where socioeconomic disparities, internal conflicts, or uneven distribution of resources could detrimentally affect a nation’s resilience despite its overall technological or economic prowess49.
Figure 3(b) compares the proposed Resilience index with the Risk Impact index. Here the two dashed lines show the median values for the two indices. Median has been chosen instead of mean to ensure a similar number of countries in each category defined by the two median lines. Generally, there is not much correlation between these two indices as a country could belong to any of the 4 categories. Figure 3 shows the values of Risk Impact and Resilience Index. We name the 4 resilience categories as follows:
- High risk – Low resilience.:
-
This category comprises countries that bear substantial exposure to personal harms and disasters, coupled with a lack of perceived resilience to these risks. Predominantly, many Latin America and African nations fall into this category, though there are notable exceptions for countries which current are or has recently been in humanitarian crises such as Afghanistan.
- Low risk – Low resilience.:
-
Countries in this group are characterised by their limited exposure to harm and disaster, yet they similarly lack of subjective resilience to risks. This category exhibits a diverse representation, with countries from various regions except North America and Oceania, including Russia, China, Poland, Pakistan, and Romania.
- Low risk – High resilience.:
-
Nations in this category are both minimally exposed to risks and exhibit high resilience to potential disasters. This is arguably the most favourable state for any country and should serve as a benchmark for others. Notably, many developed nations such as Germany, Sweden, New Zealand, Canada, South Korea, and Switzerland belong to this group, along with certain highly resilient developing countries like Indonesia, Laos, and Uzbekistan.
- High risk – High resilience.:
-
This final category includes countries that, while experiencing high exposure to harm and disasters, demonstrate significant adaptability. Respondents from these countries report a high impacts of hazards to their lives, yet possess a strong belief in their abilities to adapt to adversaries. Countries that are traditionally associated with frequent risks and disasters, such as India, Vietnam, Nepal, the Philippines, and Mozambique, fall under this classification. However, given their dense populations and high Risk Impact indices, tailored policies are necessary to transition them toward the Low risk – High resilience category.

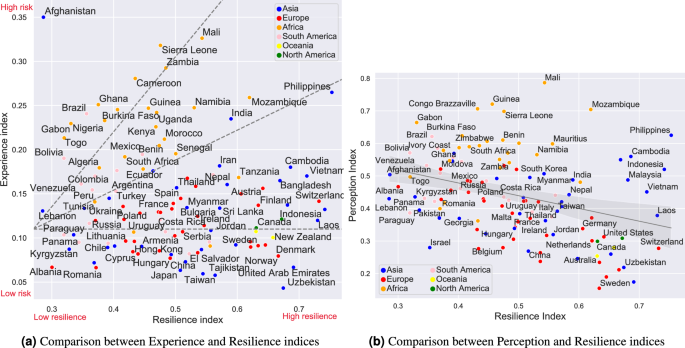
Resilience vs Perception index and Experience index.
We investigate the interplay between the Experience and Resilience indices that we propose, as depicted in Figure 4(a). To elucidate the relationship, we overlay three dashed lines representing distinct patterns observed in the data.
Two of these patterns, represented by the diagonal lines, signify that an increase in exposure to harms and disasters typically correlates with a heightened state of perceived resilience. Yet, the rate of this adaptation varies significantly from one country to another. Specifically, countries located along the upper diagonal line, such as Mali, Sierra Leone, Zambia, and Cameroon, exhibit a relatively slower belief in their adaptation to harms. This observation is consistent with their designation as High risk – Low resilience, as categorised in Figure 3(b). This implies that the primary reason for these countries falling into the High risk – Low resilience category could be their comparatively slower rate of adaptation to the risks they face.
In contrast, countries located along the lower diagonal line, including the Philippines, Mozambique, and India, appear to adapt more swiftly to harms, thereby showcasing a stronger belief in their abilities to bounce back and bounce forward from disasters. Many of these countries fall into the High risk – High resilience category, further substantiating the observation that a faster adaptation rate to risks leads to a stronger perceived resilience, even in the face of high risk exposure.
Lastly, the horizontal dashed line indicates a group of countries with consistently low exposure to harms and disasters, as evidenced by their low Experience Index. Interestingly, this group exhibits a dichotomy in terms of perceived resilience. People in some of these nations reported a lower resilience to disasters, falling into the Low risk – Low resilience category, while others reported a high resilience, thereby belonging to the Low risk – High resilience category. This divergence emphasises that low exposure to risk does not directly translate into high belief in resilience, further underscoring the multifaceted nature of risk resilience.
Figure 4(b) suggests a subtle, yet discernible, linear correlation between Perception and Resilience indices. Specifically, countries demonstrating a higher degree of perceived resilience tend to exhibit lesser concern regarding harms and disasters, relative to their less resilient counterparts. This aligns well with several studies in literature, such as in Eady et al. (2020), where respondents who are confident in their resilience exhibited lower levels of risk concern about heat waves21. A closer scrutiny of the figure reveals that countries situated below the regression line generally display a level of perceived resilience that surpasses the anticipated perception of risks when we consider the global context. This subset of nations includes many developed countries from Europe, Asia, Northern America, and Oceania, underlining the strong performance of these regions in terms of risk resilience. Conversely, the countries located above the regression line can be divided into two major cohorts: the less resilient African countries, and the highly resilient Asian countries, predominantly from Southeast Asia. The African cluster comprises countries like Guinea, Sierra Leone, Benin, and Zimbabwe, while the Asian cohort includes nations such as the Philippines, Cambodia, Indonesia, and Malaysia. Notwithstanding the palpable resilience gap separating these two groups, it is intriguing to observe a shared attribute – a high level of risk concern. Thus while a strong correlation between Perception and Resilience indices can be found, similar to Eady et al. (2020)21, this unifying trait underscores a noteworthy pattern: the level of worry about risks is not exclusively tied to a nation’s confident in resilience. Instead, it can persist irrespective of the country’s capacity to withstand harms and disasters, emphasising the complex interplay between perceived risks and resilience capabilities.
Causal discovery results
Figure 5 illustrates the final causal network structure resulted from the causal discovery analysis using Bayesian Network. Each node in the graph corresponds to a variable, and each directed edge between nodes represents a conditional probability distribution.

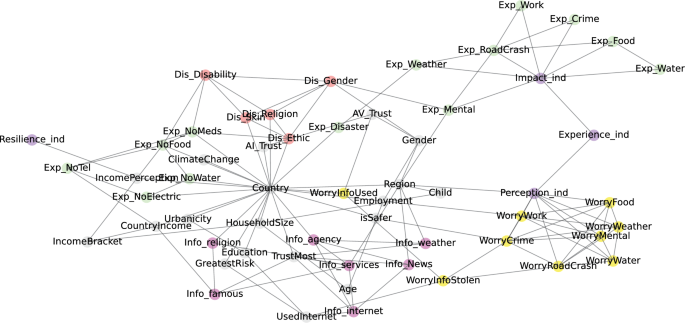
Bayesian Causal network of the World Risk Poll data.
Figure 5 provides a holistic visualisation of the conditional dependencies underlying the proposed indices and variables constituting individual risk perspectives and perceived resilience worldwide. Several key features stand out from the figure.
Firstly, fundamental demographic variables like age, gender, education level, and country of residence occupy pivotal positions near the top of the network, underscoring their overarching influence on downstream factors. The network also incorporates various mentalities and social dynamics variables around Country, such as measures of discrimination, trust in institutions, experience of major shortage of commonalities and feelings of safety to map their roles in orienting risk interpretations. This makes intuitive sense as all other variables seem to be dependent on where the respondent is from, and their life experience.
Secondly, variables capturing household characteristics, access to key resources and infrastructure, and information sources showcase the importance of socioeconomic environment in impacting risk-related attitudes and behaviours. The group of variables that telling where individuals are seeking for information (\(Info\_\) variables, located at the far left side of the figure) decides where individual will trust most (the TrustMost variable). Interestingly, if a respondent looks for information from the Internet (\(Info\_internet\)), we will know that they do use it (UsedInternet), and that they are likely to worry about their information being stolen or used (WorryInfoStolen and WorryInfoUsed).
Thirdly, the network highlights the interconnected nature of subjective risk views (through the Perception index and its related variables) and objective exposures (through the Experience and Impact index). The Perception index integrates numerous risk perception variables, representing subjective views regarding threats like crime, weather, traffic, and water access. Meanwhile, the Impact index assimilates variables capturing objective harm encounters across those risk domains. This confirms the validity of the causal network, because the Perception and Impact indices have been defined using these variables. The multiplicative linkage from Perception and Experience to the Impact index highlights the Experience index’s role in encapsulating the interplay between subjective risk interpretations and tangible exposures, and underscores the bidirectional relationship between subjective risk views and objective harm.
Finally, the position of the Resilience node as the ultimate child in the network emphasises its nature as a multifaceted emergent property, arising through complex pathways from foundational demographics to risk experiences and attitudes. an integrative outcome, shaped by the complex interplay of demographics, infrastructure, experiences, attitudes, and social environments. Despite the diversity of variables in the network, the Resilience index has only one direct parent, the IncomePerception node. This solitary direct connection underscores income perception as a pivotal precursor exerting a sizeable causal influence on individual’s confidence in their resilience globally.
Causal inference analysis
The DAG in Figure 5 shows interesting causal relationship between the four proposed indices with other variables in the World Risk Poll dataset. This section aims to confirm and quantify these causal relationships by using machine learning techniques to estimate the causal effect through Conditional Average Treatment Effect (CATE). We adopt Causal Forest Double Machine Learning (CF-DML)38 to estimate CATE, because the method allows us to control for a plethora of observed confounders and also efficiently handles multiple treatments, offering a comprehensive landscape of the treatment effects across different population group.
We first aim to quantify the causal impact of individual experience to risks to the proposed Impact index. Figure 6 shows the heterogeneity of Age and Gender when looking at the causal impact of each of the 7 experienced risks. Since the experienced risks cause the Impact index (see Figure 5), we visualise the value of CATE for the Impact Index only. The outcome variable Y, represented by \(Impact_ind\), quantifies an “Impact Index” and is postulated to be influenced by both treatment and control variables. The treatment vector T comprises seven dimensions, reflecting the seven risks that we are studying in this paper, as also discussed in Figure 1. Finally, all other variables are treated as Control variables W for the CF-DML model.
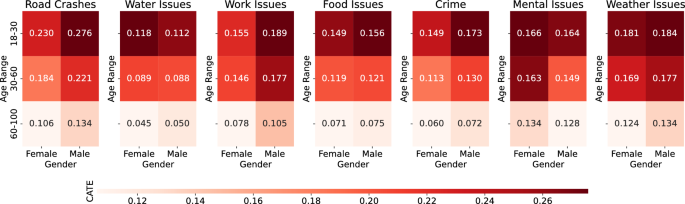
Causal effect of risks to the Impact index in different Age and Gender.
The estimated Conditional Average Treatment Effects (CATE) across age and gender segments elucidate salient heterogeneity in the causal impacts of diverse harm experiences on individual harm impact. Darker colours and greater values denote intensified causality between the risk exposure and harm impact among particular demographic subgroups. While all CATE values are positive, reflecting universally detrimental effects across groups, certain hazards like traffic crashes and meteorological events exhibit appreciably elevated CATE relative to other threats, underscoring their disproportionate impact.
A predominant pattern is the decline in CATE magnitude with advancing age for nearly all treatment types. This implies that the causal effects of harm experiences fundamentally weaken among elderly populations, potentially indicative of progressive belief in resilience accumulation across most harm domains. This aligns with inoculation theories of lifespan development and resilience, which posit the strengthening of protective capacities through lived experience50. Compelling gender variations can also be seen. Females exhibit appreciably lower CATE relative to males for a majority of risks, especially older females. Regarding specific risks, substantially elevated CATE emerges among males for occupational, traffic, and crime threats.

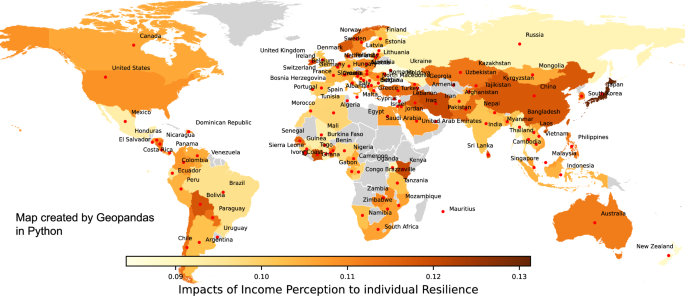
CATE of Income Perception globally.
Finally, we aim to quantify how we can make people become more resilient by improving their income, through the value of IncomePerception. Here CF-DML model uses \(Resilience_ind\) as the outcome variable Y, IncomePerception as the sole treatment variable, and all other variables as Control variables W. Similar to the previous analysis, we are interested in the heterogeneity of causal impacts to subjective resilience. Figure 7 shows how Income Perception affect Resilience index in different country. The map here was again created by using Geopandas 0.13.2 in Python40.
Figure 7 shows that in general, a unit improvement in Income Perception (i.e. from “finding it very difficult on present income” to “living comfortably on present income”) would improve the Resilience index of an individual by up to 13%. However, the effect varies between countries, where developed nations in North America, Western Europe, and Oceania predominantly exhibit highly positive CATE, implying income perception substantive positive effects on perceived resilience amid abundant socioeconomic resources51. Conversely, muted CATE in African and Latin American countries despite heightened income instability highlights that financial standing alone inadequately captures lived experiences within developing contexts marked by institutional and infrastructural limitations. Meanwhile, the high variability within Asia showcases the insufficiency of regional generalisations. By spotlighting such heterogeneity, CATE provides vital insights to inform context-specific, evidence-based policies for cultivating resilience equitably worldwide.